Burlingame vs San Bruno home prices: does a condo search change the gap?
Housing Alpha Research · Published (Pacific)
5 minute read · Editorial independence
Buyer question: how much more does Burlingame cost, and does a condo search narrow the gap?
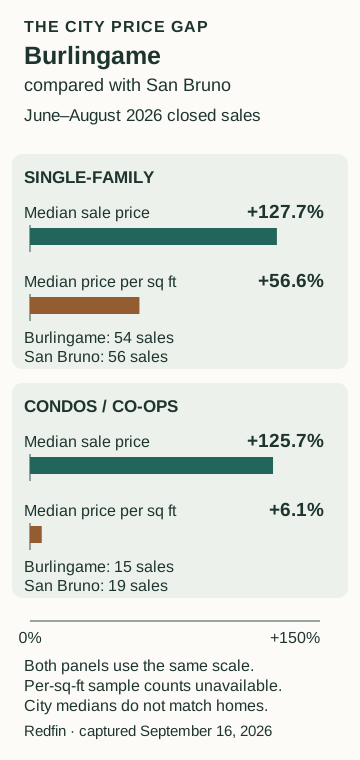
Short answer: the answer changes depending on the measure and home type. In June–August 2026, Burlingame's single-family median was 127.7% higher than San Bruno's, and its median price per square foot was 56.6% higher. For condos and co-ops, the whole-home gap was still large, but the per-square-foot gap narrowed to 6.1%. That condo comparison rests on just 15 Burlingame sales and 19 San Bruno sales.
Analysis prepared October 4, 2026. Sales observations: June 1–August 31, 2026. Source captured September 16, 2026; source rows updated September 3. These are retained closed-sale observations, not October inventory, asking prices or a live quote for a home.
Start with the home type you would buy
Every row below covers June–August 2026. The sample counts are part of the comparison, especially for condos.
| City and home type | Median price | Median $/sq ft | Sales |
|---|---|---|---|
| Burlingame · single-family | $3,318,056 | $1,565.32 | 54 |
| San Bruno · single-family | $1,457,146 | $999.54 | 56 |
| Burlingame · condo/co-op | $899,727 | $733.28 | 15 |
| San Bruno · condo/co-op | $398,629 | $691.26 | 19 |
Open Burlingame versus San Bruno for single-family homes or compare condos and co-ops for the same dates. The August endpoint represents the entire June–August rolling window. It is not an August-only median or the July–September calendar quarter.
The single-family gap survives a per-square-foot check
Burlingame's single-family median exceeded San Bruno's by $1,860,910. We calculate the 127.7% gap as Burlingame divided by San Bruno, minus one. This means the median was about 2.28 times San Bruno's; it does not mean every Burlingame house costs twice a comparable San Bruno house.
The per-square-foot difference was $565.78, or 56.6%. Both measures point in the same direction. Our interpretation is that this is a substantial difference between the two cities' sold-home populations, not merely a mismatch created by combining houses with condos. It still does not identify a premium for matched homes: neighborhoods, condition, lots and the mix of space remain uncontrolled.
This is useful for setting an initial search. If a suitable San Bruno house fits your budget and a Burlingame candidate requires much more, identify the specific room, lot, condition or location benefit you would receive. City prestige or a higher median is not evidence that the more expensive candidate will provide better future returns.
A condo search changes the question
Burlingame's condo/co-op median was $501,098, or 125.7%, higher. Its median price per square foot was only $42.02, or 6.1%, higher. The much smaller second gap is a reason to inspect the actual units behind your shortlist. It is not proof that the Burlingame units were larger: the two medians are calculated separately and cannot be divided to estimate typical floor area.
There were just 15 and 19 reported condo/co-op sales. We show the medians because both meet the site's ten-sale display floor, but neither clears our stronger 30-sale historical screen. Homes missing size information are excluded from the per-square-foot measure, and its separate sample count is unavailable. The apparent precision of dollar amounts should not hide those limits.
For particular units, compare verified space, usable layout, parking or storage rights, condition and documented association obligations. Then use the HOA, reserves and special-assessment guide. The city gap does not establish how much of a unit's purchase-price difference survives its recurring costs.
Is the difference persistent?
We selected 15 nonoverlapping June–August windows, 2012–2026, requiring the same home type and at least 30 reported sales in each city for the primary historical comparison. Every single-family summer qualified. Burlingame's price median and per-square-foot median were higher in all 15. The middle annual whole-home gap was 112.9%.
That supports a persistent difference in these sales populations. It does not turn the latest 127.7% into a permanent surcharge. In June–August 2025, the single-family medians were $2,900,000 in Burlingame across 42 sales and $1,480,000 in San Bruno across 66 sales, a 95.9% gap. Changing gaps can reflect a changing mix of sold homes as well as market conditions; they do not measure the appreciation of identical houses.
No condo/co-op summer met the 30-sale rule in both cities. At 20 sales per city, four summers qualify; at ten, eight qualify. Burlingame's price and per-square-foot medians are higher in every eligible window under both looser screens, but the evidence is thinner than for houses. Burlingame's June–August 2025 condo sample had only nine sales, so this guide does not present its median or a condo year-over-year price comparison.
Download the complete annual calculations, counts and exclusion flags. Values below the display floor remain in the research download for audit, with their counts, not as buyer-facing price estimates. Explore the single-family history; intervening rolling points overlap and must not be added as monthly counts.
Make the next comparison about your household
Use actual candidate prices and your own financing assumptions in the ownership-cost worksheet. Record one item that could justify the more expensive home and one unresolved fact that could reverse the choice in your Home Brief.
If a commute or school is decisive, test the route from each address and verify school assignment for the intended enrollment year. This guide supplies neither commute times nor an assigned school. The school-boundary guide, Burlingame city page and San Bruno city page provide the next places to look.
Public property records can help check an address, parcel or recorded event. They are a different dataset from these market aggregates and are not the underlying comparable-sales list for this table. They also do not establish verified interior living area. Use the public-record guide and source documents before relying on a property's stated space or history.
Sources and method
Original calculations use retained Redfin city data with the metric definitions reviewed October 4. Nominal prices are not seasonally adjusted. We match exact June 1–August 31 windows and keep single-family and condo/co-op populations separate. Each eligible year has equal weight; 30, 20 and ten sales are editorial screens, not guarantees of precision. Historical source estimates may be revised. No new market data, matched-home valuation or investment forecast is supplied.
Sources
Cite this article
Housing Alpha Research. “Burlingame vs San Bruno home prices: does a condo search change the gap?.” Bay Area Housing Alpha. Published (Pacific). https://bayareahousingalpha.com/articles/burlingame-vs-san-bruno-home-prices
Found an error or a source we should review? Send a correction to research@bayareahousingalpha.com, with this article’s URL and the supporting evidence.