San Francisco vs Daly City home prices: compare houses and condos separately
Housing Alpha Research · Published (Pacific)
6 minute read · Editorial independence
Buyer question: how much does the citywide price gap change when I switch home types?
Short answer: the gap was much wider for condos and co-ops. In June–August 2026, San Francisco's median price was 43.8% higher than Daly City's for single-family homes and 104.2% higher for condos/co-ops. Its median price per square foot was higher for both. Daly City's condo result came from only 15 sales, so the larger gap needs particular care.
Analysis prepared October 4, 2026. Sales observations: June 1–August 31, 2026. Both retained city captures were retrieved September 16, 2026; source rows updated September 3. This is a dated comparison of closed sales. It does not describe October listings or the price of a home available today.
Houses and condos give different answers
These rows use identical dates and separate home types. San Francisco's larger transaction sample does not remove the uncertainty in Daly City's smaller one.
| City and home type | Median price | Median $/sq ft | Sales |
|---|---|---|---|
| San Francisco · single-family | $1,868,905 | $1,149.47 | 693 |
| Daly City · single-family | $1,299,239 | $768.88 | 72 |
| San Francisco · condo/co-op | $1,224,629 | $1,111.92 | 742 |
| Daly City · condo/co-op | $599,818 | $584.61 | 15 |
Compare San Francisco and Daly City single-family homes for this window or open the condo/co-op comparison. An August ending month selects June–August sales, not an August-only observation.
A lower city median is a starting point for a search
San Francisco's single-family median was $569,666 higher. Relative to Daly City's median, that is a 43.8% gap. San Francisco's median price per square foot was $380.59, or 49.5%, higher.
Both price measures point toward a lower-cost sold-home population in Daly City in this window. That makes Daly City a reasonable place to look for homes within a constrained purchase budget. It does not establish the savings on an equivalent home or show that a particular Daly City listing is undervalued. Citywide aggregates cover different neighborhoods, properties, condition and amounts of space.
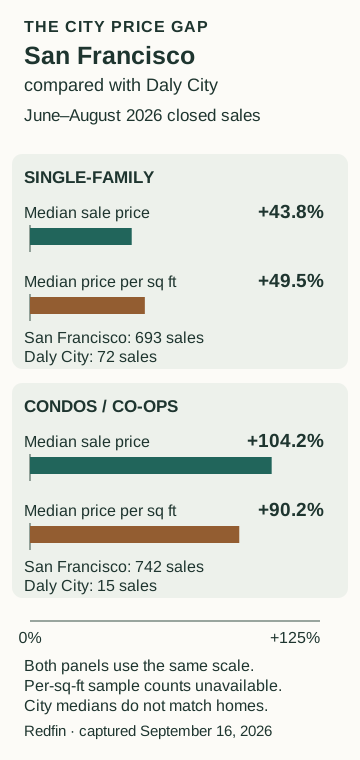
The percentages use Daly City as the denominator. They describe how much higher San Francisco's median was. They should not be read as the percentage discount obtained by moving from San Francisco to Daly City; changing the denominator changes that percentage.
The condo gap is larger, but the smaller sample matters
San Francisco's condo/co-op median was $624,811 higher, a 104.2% gap. Its median price per square foot was $527.31, or 90.2%, higher. San Francisco's median was about twice Daly City's; this does not establish twice the price for a matched unit.
The counts were 742 condo/co-op sales in San Francisco and 15 in Daly City. The Daly City sample meets our ten-sale display floor but falls below the 30-sale screen used for the primary historical summaries. More sales in San Francisco cannot compensate for missing detail about the 15 Daly City transactions.
The per-square-foot sample can be smaller still: homes without size data are excluded, and we do not have its separate count. Do not divide median price by median price per square foot to infer typical unit size. They are independently calculated medians.
For a condo shortlist, compare particular units' verified layout, condition, parking and association obligations. Price is only the first entry; the HOA and special-assessment guide helps organize the building documents that can change the ownership-cost comparison.
What the same-season history adds
Across 15 June–August windows from 2012 through 2026, both cities had at least 30 single-family sales in every summer. San Francisco's whole-home and per-square-foot medians were higher in all 15. The middle annual whole-home gap was 43.8%, the same as the latest gap after rounding.
In June–August 2025, the single-family medians were $1,554,250 in San Francisco across 672 sales and $1,200,000 in Daly City across 73 sales: a 29.5% gap. Its widening to 43.8% in 2026 is a change between two sold-home samples. It is not a tracked appreciation difference for identical properties.
Only four condo/co-op summers met the primary 30-sale-per-city rule. San Francisco's two medians were higher in all four. A 20-sale screen admits ten summers, and a ten-sale screen admits all 15; the direction stays the same for both measures. This supports the historical direction of the gap while exposing how dependent the condo comparison is on the minimum-count rule. It does not make the latest 15-sale Daly City sample precise.
Download the 30 annual home-type comparisons, counts and source locators. Explore the dated single-family history. Our test uses one nonoverlapping summer per year; the interactive chart also shows intervening overlapping rolling periods.
Cross the city boundary with a consistent checklist
Choose one realistic home on each side of your search. Keep the desired home type and usable space comparable, then record differences in condition, outdoor space and the trips your household makes. Test those trips from the actual addresses at relevant times; no citywide commute estimate is supplied here.
Use the proposed prices, financing quotes and address-specific expenses in the ownership-cost worksheet. A $569,666 difference between city medians is not automatically your down-payment difference, monthly saving or budget for repairs. The San Francisco and Daly City pages can help you explore local context, while the school verification guide explains how to check a candidate address and enrollment year.
Keep market statistics separate from public property records. This table uses the same Redfin market definitions across both cities; it is not built by combining the site's individual county records. Address records have their own geography, dates and field limitations. In particular, the site's San Mateo County property-record guide does not establish San Francisco record coverage, and a parcel area is not verified interior living area. Record unresolved address facts in your Home Brief and check the responsible source documents.
Sources and method
We matched exact city identifiers, home types and June 1–August 31 dates in retained Redfin city data. San Francisco comes from the expanded-city capture; Daly City from the original eight-city capture. Both were retrieved September 16 and report the September 3 source update. Neither is a new October release.
The metric definitions were reviewed October 4. Figures are nominal and not seasonally adjusted; each eligible summer receives equal weight. The sample screens are editorial rules, not confidence intervals. Historical estimates may be revised. This descriptive comparison neither matches individual homes nor forecasts which city will appreciate faster.
Sources
Cite this article
Housing Alpha Research. “San Francisco vs Daly City home prices: compare houses and condos separately.” Bay Area Housing Alpha. Published (Pacific). https://bayareahousingalpha.com/articles/san-francisco-vs-daly-city-home-prices
Found an error or a source we should review? Send a correction to research@bayareahousingalpha.com, with this article’s URL and the supporting evidence.