Peninsula housing: more inventory does not always mean more negotiating room
Nine screened Peninsula cities had more single-family inventory, yet seven had flat or faster time to contract. Compare the same-season evidence before assuming a home offers a discount.
Housing Alpha Research · Published 2026-10-04
5 minute read · Editorial independence
October 2, 2026 analysis · Single-family homes · June–August 2026 versus June–August 2025. Inventory is measured on August 31 in each year. The underlying data was captured September 16; this is a new analysis, not a new month of sales.
More homes on the market can give you more properties to consider. It does not tell you, by itself, that sellers are accepting lower offers or giving buyers more time.
Redwood City illustrates the difference. Its reported single-family inventory rose from 25 to 33 homes, yet median time to contract fell from 15 to 13 days. The share of closed sales above the original asking price rose from 52.25% to 70.71%. For a buyer, the useful conclusion is to investigate the extra options—not assume a citywide discount.
The pattern extends beyond one city
We screened all 25 cities covered by Housing Alpha, keeping single-family homes separate from condos. Sixteen cities had at least 30 reported closed sales in both comparison windows and usable values for our three measures. Nine of those had more homes for sale on August 31, 2026 than on the same date in 2025.
Among those nine cities:
- Seven had the same or fewer median days to contract. More inventory did not coincide with a longer median marketing time in those places.
- Eight had a higher share of sales above the original list price. Los Altos was the exception, moving from 63.89% to 62.14%.
These counts describe this selected group and these dates. They are not a rule about every Peninsula neighborhood or evidence that inventory causes competition to rise.
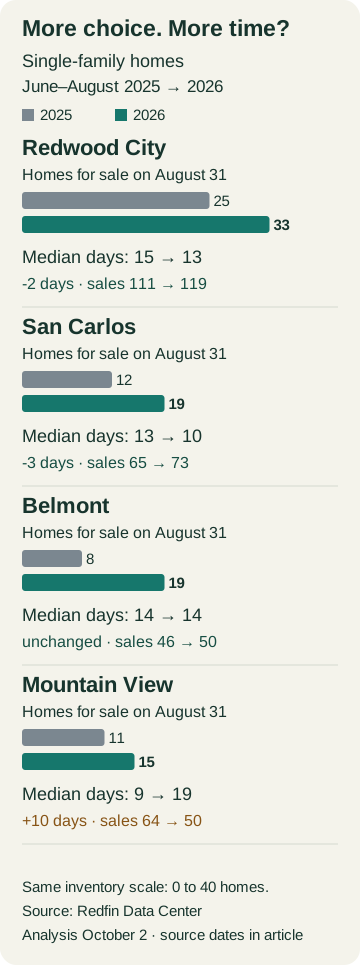
Read the counts behind the percentages. Redwood City's increase was eight homes, or 32%. Belmont's was eleven homes, or 137.5%, because it started with only eight. San Carlos added seven, from twelve to nineteen. A large percentage can come from a small starting stock; the counts help you judge its practical scale.
The nine cities with rising inventory were Belmont, Burlingame, Los Altos, Millbrae, Mountain View, Palo Alto, Redwood City, San Carlos and South San Francisco. Download the comparison for all 16 eligible cities, including the cities where inventory did not rise. The file contains the source levels and both closed-sale counts so you can inspect the included observations.
Mountain View shows why one label is not enough
Mountain View's inventory rose from 11 to 15, and its median marketing time lengthened from 9 to 19 days. That is a different pace signal from Redwood City or San Carlos. But its above-original-list share was essentially flat: 67.19% to 67.36%, a difference of just 0.17 percentage points. Its reported closed-sales count fell from 64 to 50.
That mix is a reason to investigate a particular home's pricing and listing history. It does not establish that the seller will accept less, or that comparable homes have become cheaper. A 19-day median is also not a promised window in which to make an offer.
Compare Mountain View and Redwood City over these dates. The comparison tool shows the separate price, sales and price-per-square-foot history; this article adds the dated inventory and marketing-time analysis. For the neighboring San Mateo/Redwood City price question, read why the median-price gap looks different per square foot.
Three checks before treating a home as negotiable
- Check the alternatives that meet your needs. A citywide inventory increase is not a count of available homes with your bedrooms, condition, location and budget. Keep the actual alternatives beside the home you are considering.
- Check that home's listing history. Review the initial asking price, subsequent changes, relistings and current status. A deliberately low initial asking price can make an above-list result look strong without showing a premium over comparable homes. The city measure does not record seller concessions or explain an individual seller's priorities.
- Put your price beside evidence and costs. Open a Home Brief with an address or APN to review available public facts and recorded-price context. Enter your own asking or offer scenario when you have one, compare the ownership costs, and save the evidence and unanswered questions. Public recorded amounts remain incomplete context, not verified comparable sales or a current valuation.
A useful outcome is a shortlist of alternatives and a reason for your proposed price. “Inventory is up” is a starting question, not that reason on its own.
What the measures mean
Redfin's inventory is the stock available on the period's last day. Median days on market measures listing-to-contract time for homes entering contract during the window. Both exclude listings older than a year. Above-original-list share concerns closed sales, using their original asking prices. These populations differ; reported closed-sales counts are not the sample size for marketing time. See Redfin's metric definitions.
We compare the same season without seasonal adjustment. These June–August windows are not calendar quarters, and adjacent monthly points overlap. We do not add their sales counts. The 30-sale threshold is an editorial screen for very small samples, not a statistical significance test. There is no matched-home analysis, measured discount, appreciation forecast or buyer/seller-market score here.
Source dates and review
Calculations use retained Redfin Data Center city aggregates, captured September 16, 2026; the 2026 rows are labeled updated September 3. We derived changes from the metric levels, not the source's precomputed change columns. October 2's freshness check still showed August 31 as the site's latest verified city-market period. The publisher's calendar lists October 8 for its September monthly release; that is a schedule, not evidence those observations are already available. Source methodology and release calendar.
Historical figures can be revised, and the mix of homes changes. This edition retains the original capture rather than claiming its analysis date is a new data vintage. An eventual update should rerun the same screen and report what changed—not quietly move these baselines.
Sources
Cite this article
Housing Alpha Research. “Peninsula housing: more inventory does not always mean more negotiating room.” Bay Area Housing Alpha. Published . https://bayareahousingalpha.com/articles/peninsula-inventory-negotiating-room-2026
Found an error or a source we should review? Send a correction to research@bayareahousingalpha.com, with this article’s URL and the supporting evidence.