San Mateo vs Redwood City: compare the homes behind the price gap
Redwood City’s single-family sale-price median was 9.9% higher in June–August 2026, while price per square foot was nearly equal. Use the dated comparison to narrow your search and compare actual homes.
Housing Alpha Research · Published 2026-09-25
5 minute read · Editorial independence
June–August 2026 edition. This comparison uses closed-sale aggregates captured on September 16, 2026. It is a dated view of those sales, not a live inventory or asking-price report.
If you are choosing between San Mateo and Redwood City, start with the kind of home you want. In this period, Redwood City's single-family median sale price was $212,375 higher, while the cities' median prices per square foot were almost equal. That is a useful reason to compare actual homes before ruling out either city on its headline median.
Open San Mateo versus Redwood City with these dates and single-family homes selected. You can change the home type or look back through earlier periods.
The single-family price gap looks different per square foot
For June 1 through August 31, 2026:
- San Mateo: $2,148,741 median sale price; $1,341.62 median price per square foot; 140 closed sales.
- Redwood City: $2,361,116 median sale price; $1,335.91 median price per square foot; 119 closed sales.
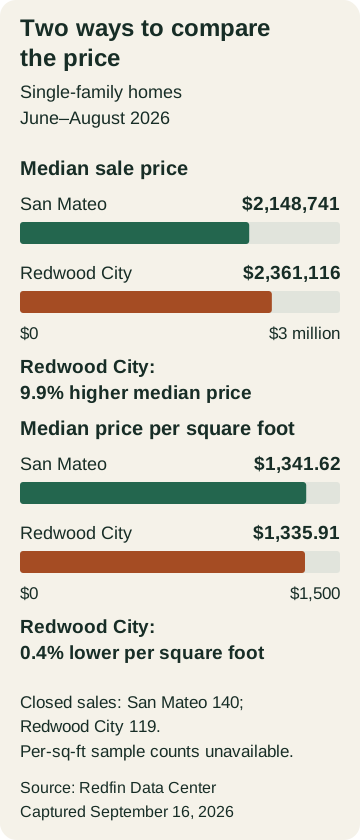
Redwood City's sale-price median was 9.9% higher, using San Mateo as the denominator. Its per-square-foot median was 0.4% lower. These are our calculations from the same dated Redfin Data Center source.
The practical takeaway: a lower city median does not establish a discount for the home you want. A city can have a different mix of space, lots, condition and locations among its sales. Investigate those differences in your own shortlist; this aggregate comparison does not establish which one explains the gap.
Do not divide the sale-price median by the per-square-foot median to estimate a typical home's size. They are separate medians, and the per-square-foot figure excludes homes without size data. Its sample can be smaller than the reported sales count. Redfin's definitions explain the measures.
A condo search changes the comparison
The same dates produce a different gap for condos and co-ops:
- San Mateo: $793,509 median price; $750.31 per square foot; 62 sales.
- Redwood City: $999,697 median price; $772.11 per square foot; 32 sales.
That is a 26.0% sale-price gap and a 2.9% per-square-foot gap, again using San Mateo as the denominator. Keep this population separate from single-family homes. Open the condo and co-op comparison.
For a condo buyer, the next useful comparison is between particular buildings and units. Put HOA dues and any documented special assessment alongside the purchase price, check what the dues cover, and review the association's financial and insurance documents. Two units with similar asking prices can create different ownership obligations. Use the condo HOA buyer guide to organize that review.
Check the same season before calling a gap a trend
In June–August 2025, the single-family medians were $2,026,500 in San Mateo and $2,150,000 in Redwood City, with 136 and 111 sales respectively. The gap was 6.1%, versus 9.9% in this 2026 window: a widening of 3.8 percentage points.
That comparison describes two groups of sold homes. It does not measure the appreciation of an identical property, establish that Redwood City offers better future returns, or tell you what premium to pay. Choosing the same season reduces one obvious mismatch, but it does not match bedrooms, size, condition or neighborhoods.
Explore both periods and the intervening history. Each point covers three months. June–August is a rolling window, not the July–September calendar quarter; adjacent monthly points overlap. Do not add their sales counts or treat their medians as single-month prices. See our guide to comparing home prices for a worked explanation.
Turn the city comparison into a home decision
Keep both cities on your initial shortlist if suitable homes appear within reach. Then choose an actual candidate in each and answer four questions:
- Are these homes comparable enough? Match the home type, usable interior space, bedroom needs, condition and lot or outdoor-space requirements. Verify conflicting facts through documents and inspection rather than filling gaps with a city average. Our public-record guide shows where to start.
- What will each home require every month and at purchase? Use the purchase price you are considering, your financing quote, address-specific tax and insurance information, association obligations and repair estimates. The $212,375 city median gap is context; it is not automatically the gap between your homes. Start with the ownership-cost worksheet.
- Does the location work for your household? Test the route from each address to the places you actually use, at the times that matter. If a school is part of the decision, verify the address and enrollment year using the school-boundary guide. A city name is not a school assignment.
- Which unanswered question could change the choice? Write down one concrete check for each home: a repair estimate, a document explaining usable space, an HOA obligation, or an address-specific school confirmation. Keep that question next to the home in your private home comparison.
The useful outcome is a shortlist you can explain: the homes that meet your needs, the total cost assumptions you used, and the evidence still needed before deciding. For additional local context, read the San Mateo city analysis and Redwood City city analysis; their observation dates and research scope are separate from this sales comparison.
Sources and scope
This edition uses retained Redfin city aggregates, separated into Single Family Residential and Condo/Co-op, in nominal dollars and without seasonal adjustment. Source rows report an update date of September 3, 2026; we retrieved them September 16. The source methodology was reviewed September 25. Historical data can be revised, and this edition preserves the capture used for its calculations.
The figures describe the source's citywide sales populations, not a matched set of four-bedroom homes or a complete set of comparable properties. We did not inspect homes, download a new sales release, measure commutes, or verify an individual listing's price or school assignment. The site's separate public property records also do not provide verified interior living area. Use exact home evidence for the next stage of your decision.