Peninsula housing seasonality: a summer price dip is not the whole story
Across 14 covered cities, summer 2026 prices dipped from spring but were higher than a year earlier in 13 cities. Use the same-season history before assuming a buying discount.
Housing Alpha Research · Published 2026-10-04
5 minute read · Editorial independence
October 3, 2026 analysis · Single-family homes · Observations through August 31, captured September 16.
A lower summer median price is a reason to investigate the homes that sold, not a reason to assume your target home has become cheaper. Across a fixed group of 14 Peninsula and San Francisco cities, the median city price change from spring to summer 2026 was −1.4%. Yet 13 of those 14 cities had a higher summer median price than a year earlier.
For a buyer, the comparison date changes the story. Before interpreting a dip as a buying opportunity, check both the same season last year and the price and condition of homes you would actually consider.
More time has been more common than lower prices
We compared March–May with June–August for each year from 2012 through 2026. These are two separate three-month periods, with no overlap. They are not calendar quarters, and “summer” here ends August 31.
The same 14 cities qualify in every year. We selected this panel retrospectively using coverage and sales counts through 2026 in the September 2026 source release. It is a historical description, not a selection rule available in 2012 or an out-of-sample test. For each city we calculated the percentage change in its median sale price and the change in its median days to contract. We then took the middle value across cities, giving each city equal weight. These are not pooled Peninsula prices or the price change of a typical individual home.
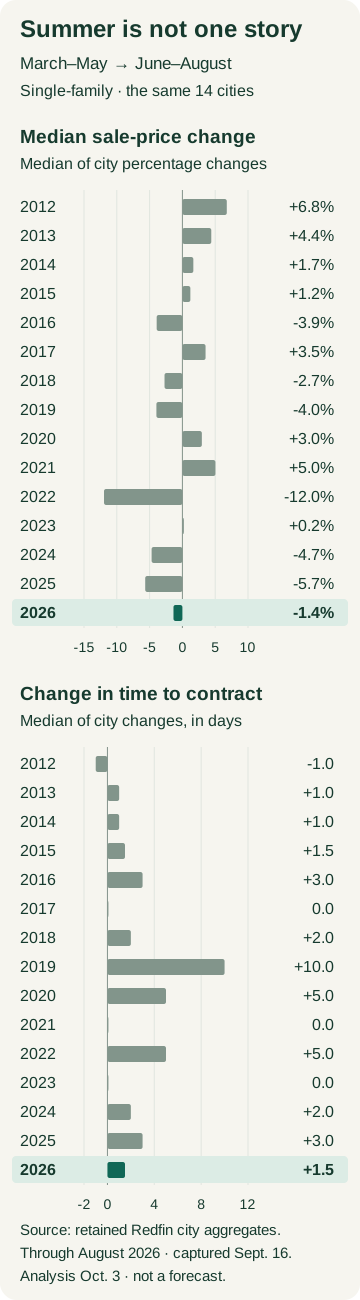
Across the 14 historical years, 2012–2025:
- The median city change in marketing time was positive in ten years. A slower spring-to-summer pace was common in this sample.
- Median sale price fell in six years and rose in eight. A summer price discount was not a consistent result.
- The annual median city price changes ranged from −12.0% to +6.8%. That wide range includes unusual market years; it is descriptive history, not a forecast band.
In 2026, the median city change was +1.5 days alongside the −1.4% price change. Both sit within the earlier observed ranges. That makes the latest transition less exceptional than a one-period headline might suggest. It does not prove that the calendar caused it or rule out a change in market conditions.
Change the comparison and the conclusion changes
Compared with June–August 2025, summer 2026 median prices were higher in 13 cities. Marketing time was longer in two cities, unchanged in two and shorter in ten. This check uses the same 2026 observations, so it is context rather than a second independent test.
San Mateo makes the distinction concrete. Its median price fell 3.2%, from $2,220,000 in March–May to $2,148,741 in June–August 2026. But that summer figure was 6.0% above the previous summer's $2,026,500. Median time to contract fell from 12 to 11 days during 2026 and matched the previous summer's 11 days. Its source reports 137 spring closed sales and 140 summer closed sales in 2026.
San Carlos also had a lower summer median price than in spring: −8.8%, from $2,850,000 to $2,598,477. Its summer median remained 1.9% above summer 2025, while median marketing time shortened from 11 to 10 days within 2026. Reported 2026 closed-sale counts were 77 and 73. Lower median prices and faster contracts can occur together.
Compare San Mateo and San Carlos across these dates. Keep single-family homes selected, and compare the points ending May and August. Intervening monthly chart points are overlapping three-month windows; do not add their sales counts.
How to use this after an open house
Ask whether the change is in the city's sales mix, the homes competing with yours, or both. A median can fall when smaller or less expensive homes make up more of the sales, even without a comparable home becoming cheaper.
Then check the specific alternatives: similar space, condition and location; current asking prices; and verified closed-sale context. City marketing time cannot tell you how long a particular seller will wait. A citywide change does not set an offer discount.
The practical takeaway is to use the calendar as a comparison tool. This history does not identify a reliably cheaper month to buy. If a home fits your needs and costs, evaluate its evidence rather than waiting solely because the city median dipped.
Coverage and evidence
We screened all 25 site-covered cities before calculating outcomes. Fourteen met our requirement of at least 30 reported closed sales in both windows in every year. The fixed group prevents changing city membership from driving the historical comparison, but favors larger markets. Download every city-year comparison and exclusion, or the annual chart values.
The data is a retained Redfin city-aggregate download, not October sales. Redfin's definitions distinguish closed-sale prices from listing-to-contract time for homes entering contract; the latter excludes listings older than a year. Closed-sale counts are not marketing-time sample counts, and our 30-sale floor does not establish precision.
Historical source values can be revised. This analysis holds the September 16 capture fixed, uses no formal seasonal adjustment or matched-home model, and makes no causal or forecast claim. The cities and years are related observations; we do not treat them as independent trials.
Sources
Cite this article
Housing Alpha Research. “Peninsula housing seasonality: a summer price dip is not the whole story.” Bay Area Housing Alpha. Published . https://bayareahousingalpha.com/articles/peninsula-housing-seasonality-summer-2026
Found an error or a source we should review? Send a correction to research@bayareahousingalpha.com, with this article’s URL and the supporting evidence.